
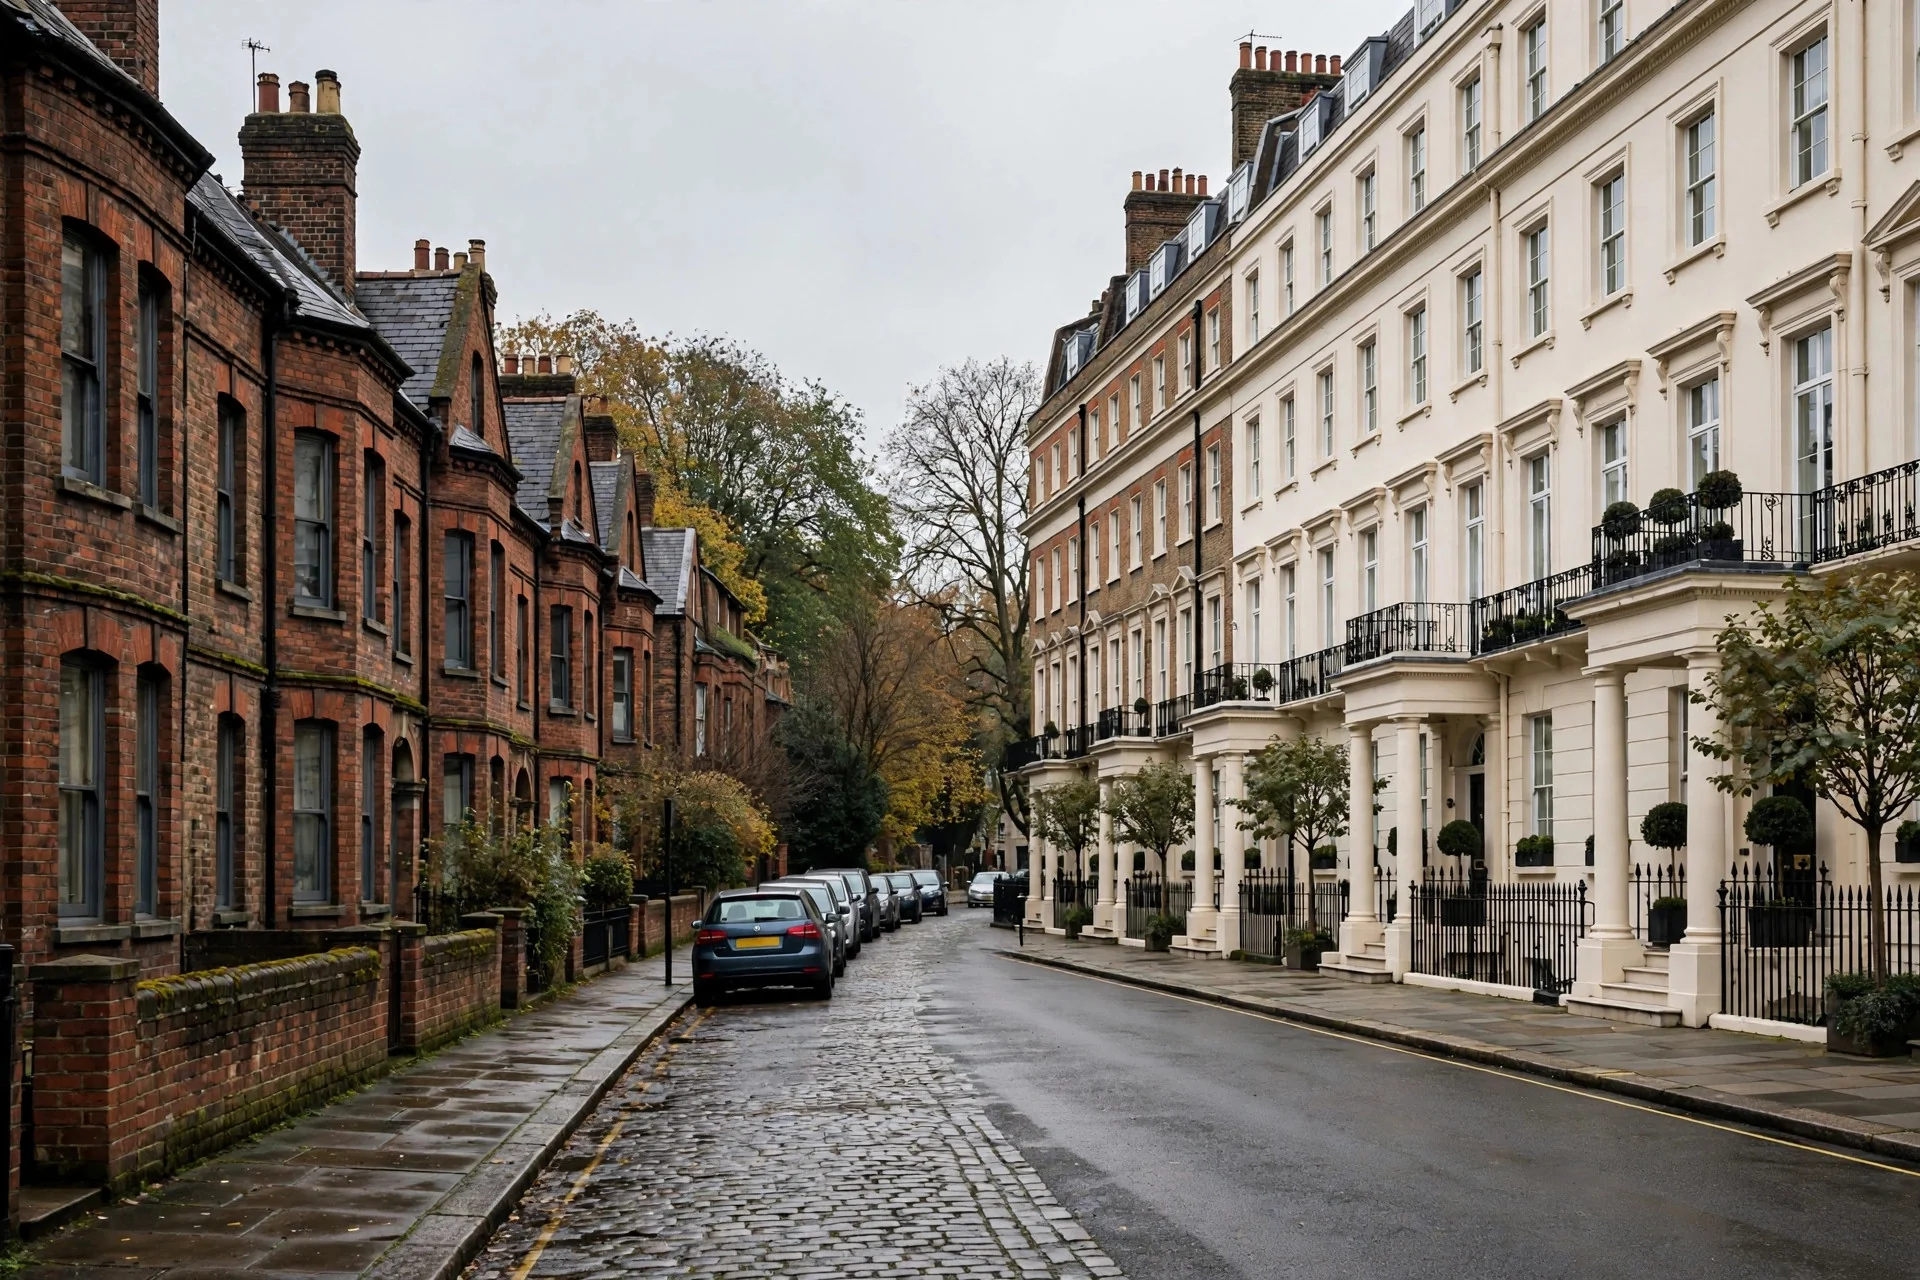
Two housing markets, one country. In 2026, the gap between the North and South of the UK has rarely looked wider. While buyers in Manchester and Newcastle are watching prices climb, sellers in London and the South East are having to trim their expectations just to get viewings through the door.
The latest figures from the country’s biggest mortgage lenders tell a strikingly consistent story: the North is holding up, the South is cooling — and Northern Ireland is in a league of its own.
The divide in numbers
Start with Nationwide’s third-quarter regional data, and the contrast is stark. The North West was the strongest-performing English region, with house prices up 3.9% on the year. At the other end of the scale, East Anglia was the weakest, with prices down 0.7% over the same period.
Step back to the national picture and the market looks broadly flat. Nationwide’s September index showed annual price growth halving to 0.8%, down from 1.6% in August — the weakest rate since December 2025. Prices slipped 0.2% on the month, leaving the average UK home at £274,251.
Lloyds’ index — the measure formerly known as Halifax — tells the same story with its own regional split. In September, the North East rose 2.4% and the North West 1.9% on the year, while London fell 2.2% and the South East dropped 2.1%. Across the UK as a whole, the average price stood at £298,441 — unchanged on both the month and the year.
Then there is Northern Ireland, which topped both lenders’ regional tables with annual growth of 7.4%, taking the average price there to a record £231,917.
What about asking prices? Rightmove’s September data showed sellers listing at an average of £367,440 — up 0.7% on the month, but still 0.8% lower than a year earlier. That gap between asking and achieved prices is a telltale sign of a market where vendors are having to stay realistic.
Here is the regional scorecard at a glance:
- North West: +3.9% a year (Nationwide) — the strongest English region
- North East: +2.4% a year (Lloyds)
- Northern Ireland: +7.4% a year — a record average price of £231,917
- London: −2.2% a year (Lloyds)
- South East: −2.1% a year (Lloyds)
- East Anglia: −0.7% a year (Nationwide) — the weakest English region

Why the North is pulling ahead
The simplest explanation is affordability. After years in which southern prices sprinted ahead of wages, buyers in London and the South East are stretched to their limits. In the North, where prices are far lower to begin with, higher borrowing costs bite less deeply — and that resilience is now showing up clearly in the data.
There is a silver lining in the national numbers, too. Nationwide’s chief economist Robert Gardner noted that “underlying affordability is improving, as house price growth has been well below earnings growth for some time.” In plain English: pay packets have been rising faster than house prices, and that slow rebalancing is gradually putting buying back within reach — particularly in regions where prices were never overheated.
Demand is stirring as well. Lloyds reported that new buyer enquiries are at their highest since February, a sign that would-be movers who sat out the summer are coming back to the market. With southern prices softening and northern markets still moving, many of them are looking north, where their budgets stretch so much further.
What it means if you’re buying
For first-time buyers and movers alike, the message is clear: where you buy matters more than it has in years. The same budget that secures a one-bedroom flat in parts of London can buy a three-bedroom semi in Greater Manchester or Tyneside — with money left over for the stamp duty and the move.
That is not just a lifestyle choice; it is a financial one. A smaller mortgage means lower monthly payments, a bigger equity cushion and far less exposure if prices wobble. In a market this split, doing the maths before you fall in love with a property is essential.
Start with what you can actually afford. Our free affordability calculator shows what you could realistically borrow — and buy — on your income and deposit. And if you are torn between staying put and taking the plunge, the rent vs buy calculator compares the true long-term cost of renting against buying, year by year.

What it means for landlords and investors
The regional split matters just as much for investors — arguably more. Lower purchase prices in the North typically translate into stronger rental yields, the single most important number in any buy-to-let decision. A terraced house bought for £150,000 and let for £850 a month generates a far healthier yield than a £450,000 London flat bringing in £1,600.
With southern capital growth now in reverse, yield is doing even more of the heavy lifting for landlords. Before committing to any property, run the numbers properly: our buy-to-let yield calculator works out gross and net rental yields, monthly cashflow and annual profit — so you can compare a terrace in Leeds with a flat in Croydon on a like-for-like basis.
The bottom line
The UK is not one housing market in 2026 — it is several. The North West, the North East and Northern Ireland are growing; London, the South East and East Anglia are going backwards. As ever, the national averages hide the real story.
Whether you are buying your first home, moving up the ladder or building a portfolio, this year’s winners will be the buyers who look beyond the headlines and do their homework on the region that suits their budget. The value is out there — and increasingly, it is in the North.
See where your money goes furthest: explore our free UK home buyer toolkit — calculators for affordability, stamp duty, mortgage overpayments, rent vs buy and more.

Comments are closed.